Plotting traffic camera locations in Hong Kong with GeoPandas
Recently I’ve had cause to work with geospatial data in Amazon SageMaker and needed a way to visualise the results. I’ll write more about SageMaker itself in a future post. In this post I aim to summarise a bit of what I learned about working with geospatial data in Python, in particular using GeoPandas.
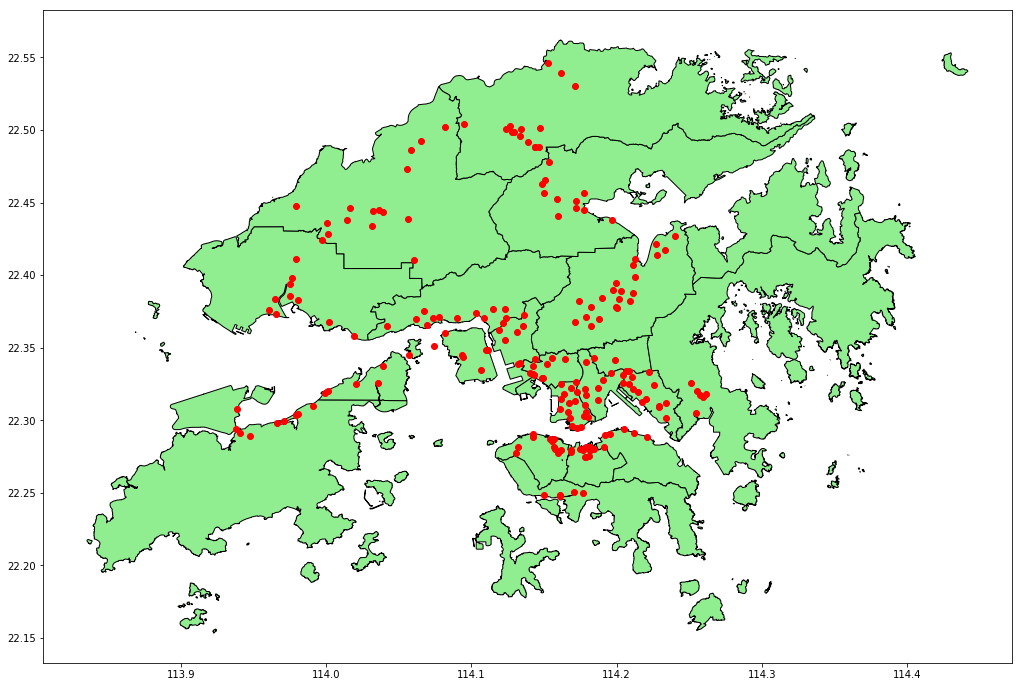
I created a Jupyter Notebook that demonstrates how to use GeoPandas to load a set of points, in this case locations of traffic cameras in Hong Kong (as it happens, from the same dataset I used to create this), and layer them on top of a shapefile representing a map of the 18 districts of Hong Kong, resulting in a visualisation such as the one below.
The complete source code is available on GitHub.
Using Amazon SageMaker Notebooks
This code will run in any Jupyter environment. I used an Amazon SageMaker Notebook, as described below. Amazon SageMaker is part of AWS, so you will need an AWS account to follow this approach.
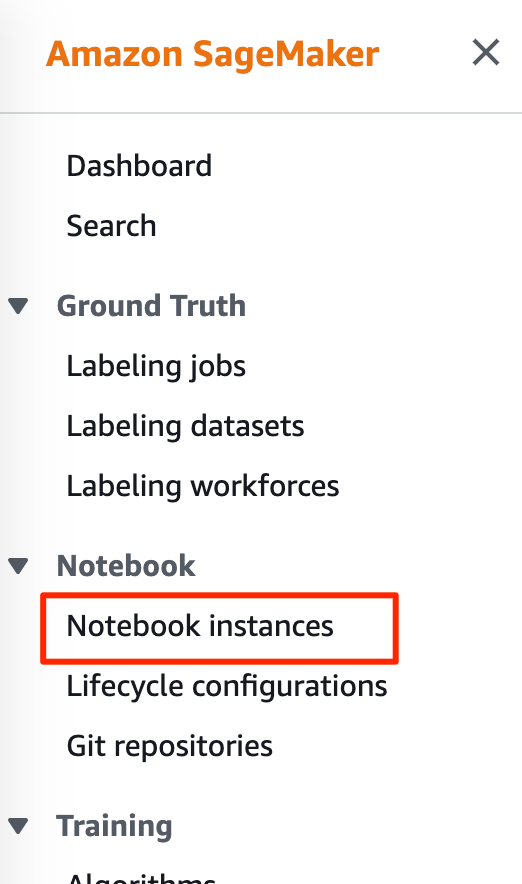
Start by navigating to Amazon SageMaker in the AWS console. In the Amazon SageMaker menu, under Notebook, select Notebook instances.
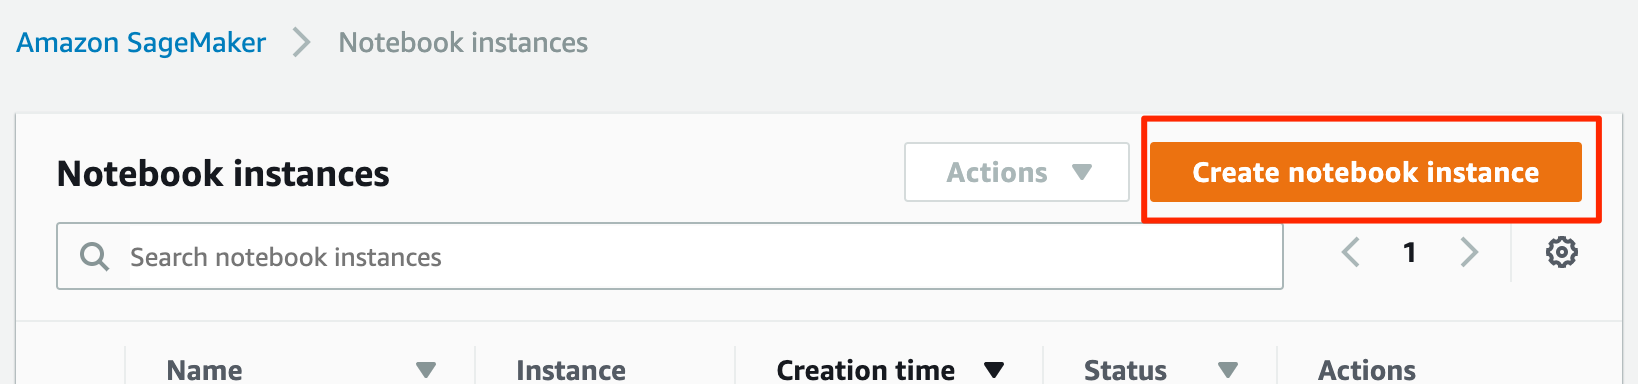
On the Notebook instances page, click Create notebook instance.
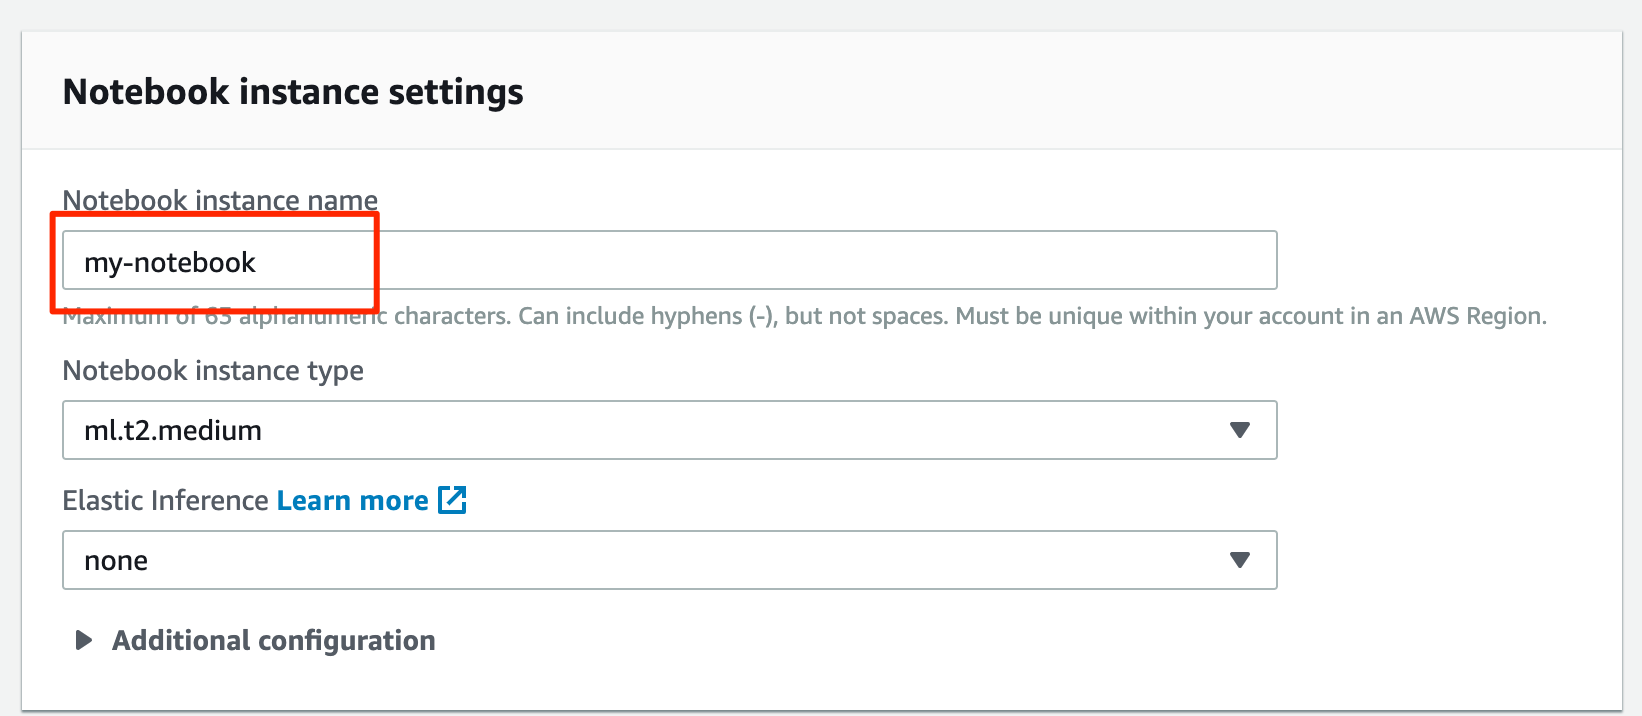
Under Notebook instance settings, give your instance a name.
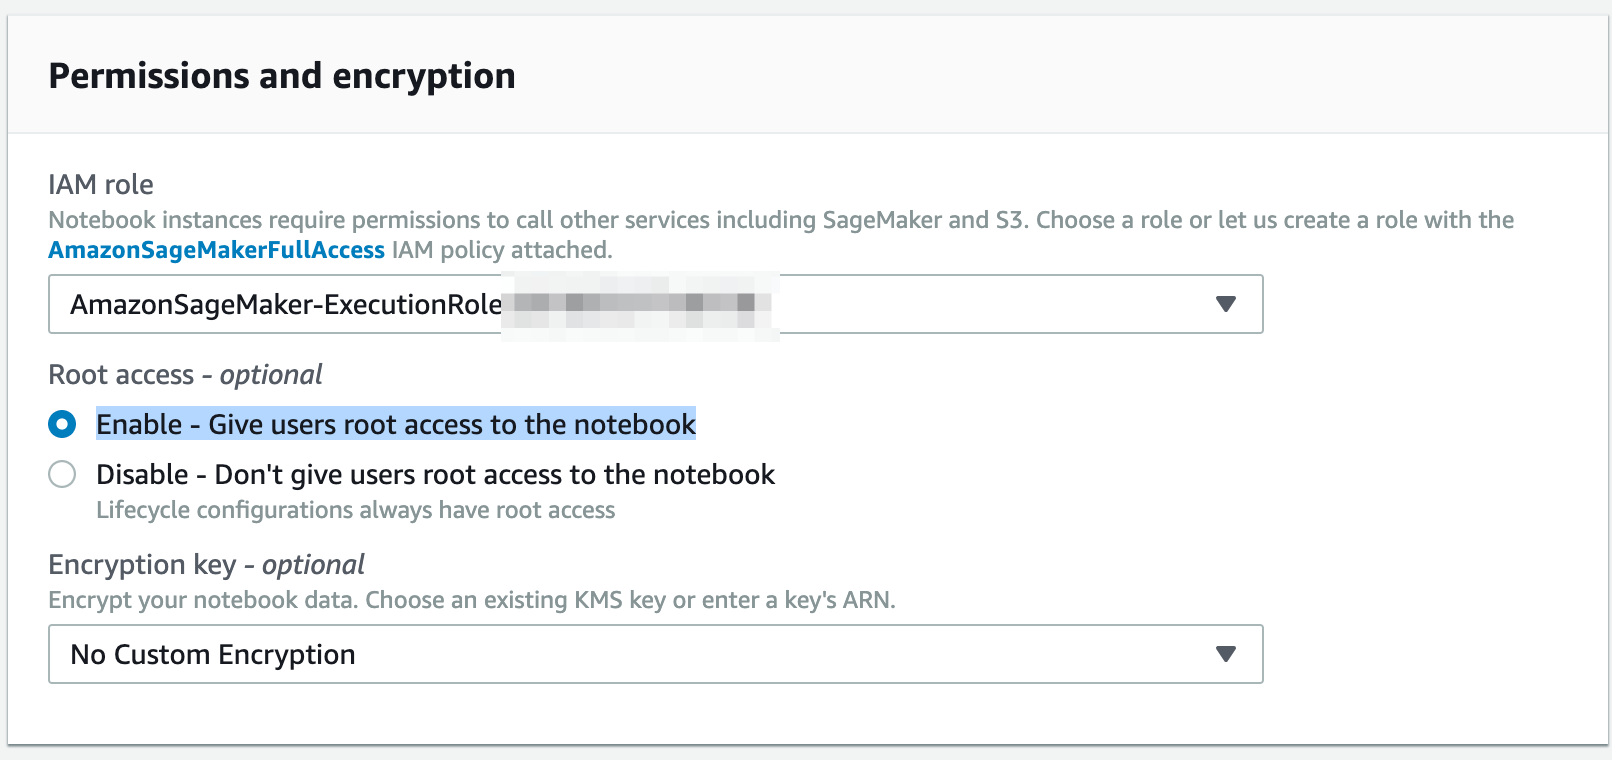
Under Permissions and encryption, if you don’t already have a SageMaker role, choose Create a new role under IAM role. The role defaults should be fine as the notebook doesn’t require any special permissions. Under Root access select Enable – Give users root access to the notebook.
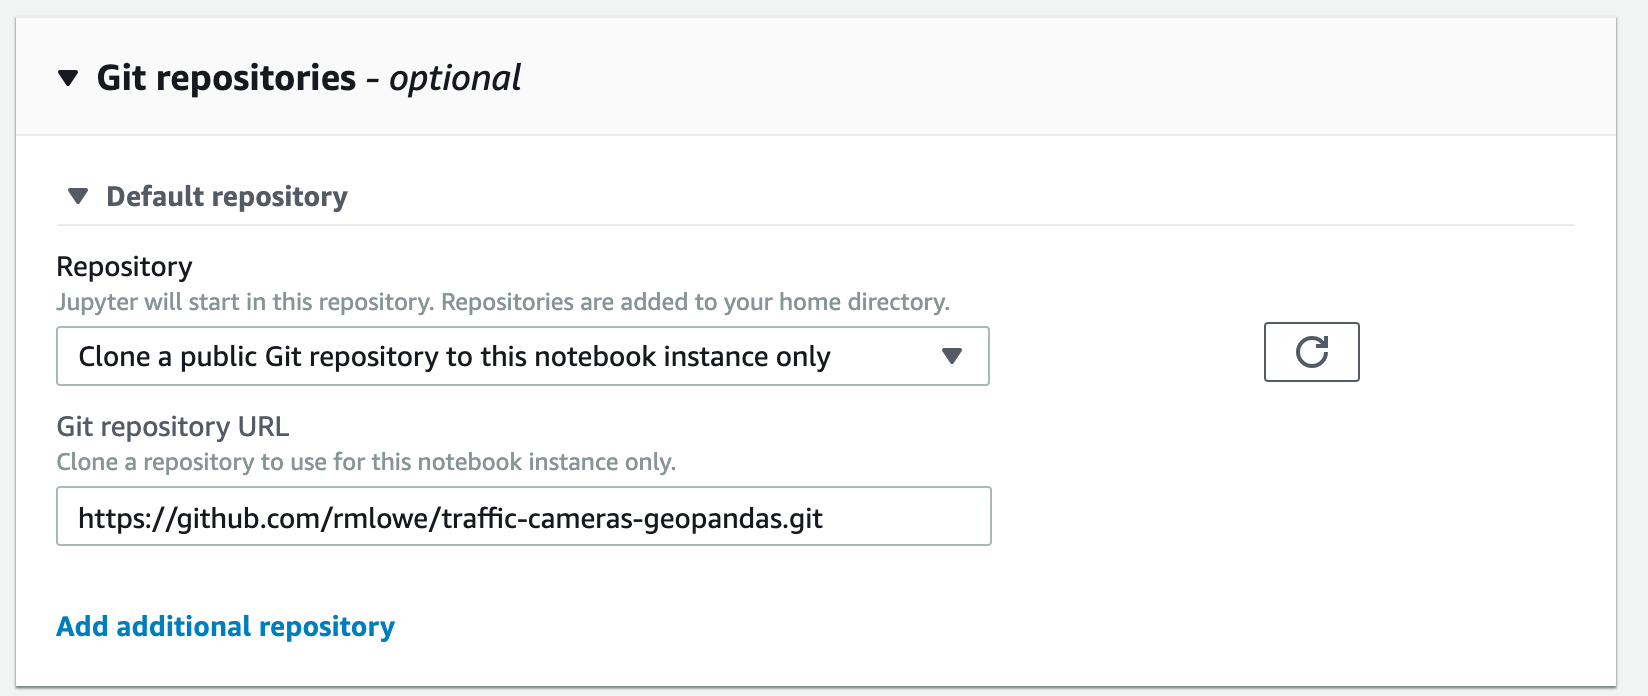
Under Git repositories, choose Clone a public Git repository to this notebook instance only. Under Git repository URL, enter the URL of the repository, which is https://github.com/rmlowe/traffic-cameras-geopandas.git.
Alternatively, you could fork this repository, and then add the forked repository to your Amazon SageMaker account. That allows you to associate credentials with the repository in SageMaker, so you can push changes back up to the forked repository.
You can leave other settings at their default values, and click Create notebook instance.
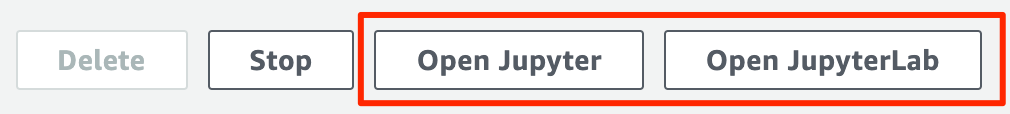
It might take a few minutes for the instance to start. Once the instance is started, click on the instance name under Notebook instances, then click on either Open Jupyter or Open JupyterLab to access the notebook. (I recommend using JupyterLab since it has out-of-the-box integration with git.)

[…] my previous post I talked about using GeoPandas to visualise geolocation data (the locations of traffic cameras in […]
Clustering geolocation data using Amazon SageMaker and the k-means algorithm | Robert Lowe
August 26, 2019 at 8:52 am